A demand for efficient gas leak detection instrumentation which is preferably to be mounted on low-flying aircraft such as a helicopter continues to grow worldwide due to an increasing number of gas pipelines and gas installations. IR thermography has been always regarded as an attractive candidate tool for detecting gas leaks due to its unbeatable remote operation principle. IR thermography is typically used in three types of gas detectors:
- active systems which implement tunable lasers illuminating the ground surface;
- spectrumsensitive passive IR systems which view the ground surface through gas plumes;
- passive IR thermographic systems which monitor temperature variations temperature in leak sites.
Systems of the first type become less efficient with squared distance, thus their operation is typically limited by some 10 meters in the case of IR thermographic systems [1] and up to a hundred meters if IR spotscanning systems, which are similar to the one described below, are used. Passive systems either suffer from multiple noises (in purely ‘thermographic’ implementation) and, thus are low-sensitivity, or require advanced multi- or hyper-spectral data analysis [2].
In this paper, a three-channel airborne IR system intended for remote gas detection is presented. The system is called GLD (Gas Laser Detector) and was recently tested in the framework of the ALMA (Airborne Laser Methane Assessment) project in the USA. A 15 mW tunable diode laser unit operating at 1650 nm is the core of the system. A helicopter-mounted unit allows detecting leaks of natural gas at the distance of up to 150 m from a transmission pipeline. Aerial survey results are presented as on-line records of gas concentration. Ground surface coordinates are provided by a built-in GPS system. Simultaneously, a pipeline route is monitored with an IR imager allowing additional detecting of larger gas plumes, as well as tracing variations in pipeline depth. In parallel, the route details are recorded on a standard video. The specialized software enables matching the data obtained by each of three channels to true ground coordinates and comparing images captured in both visual and IR wavelength band to the corresponding concentration profile. The sensitivity of the system by the laser channel is 100 ppm*m at 100 m by methane.
System Description
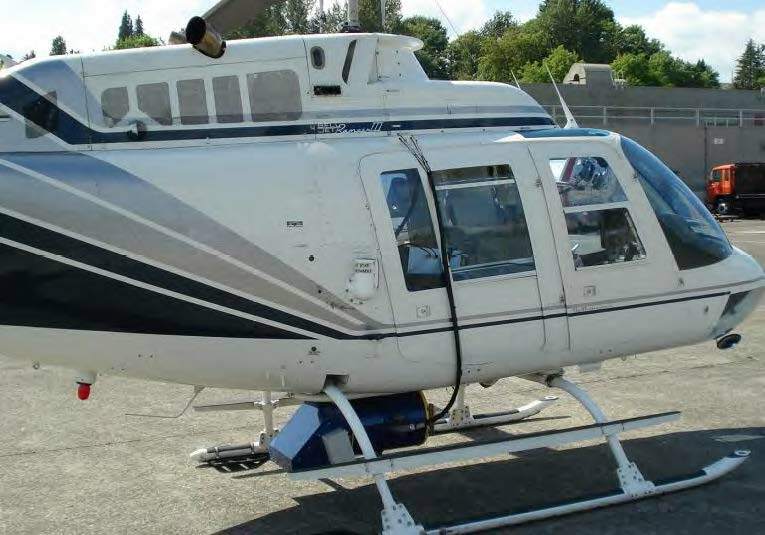
A gas detection system can be mounted on an airplane, helicopter or balloon, as well as on a ground-moving vehicle. As a helicopter-based system, it monitors the ground surface either from a cabin through a hatch (under the direct angle) or from a special arm installed aside a helicopter cabin (Figure 1). Both a digital video recorder and a laptop computer are mounted in the cabin along with a GPS receiver.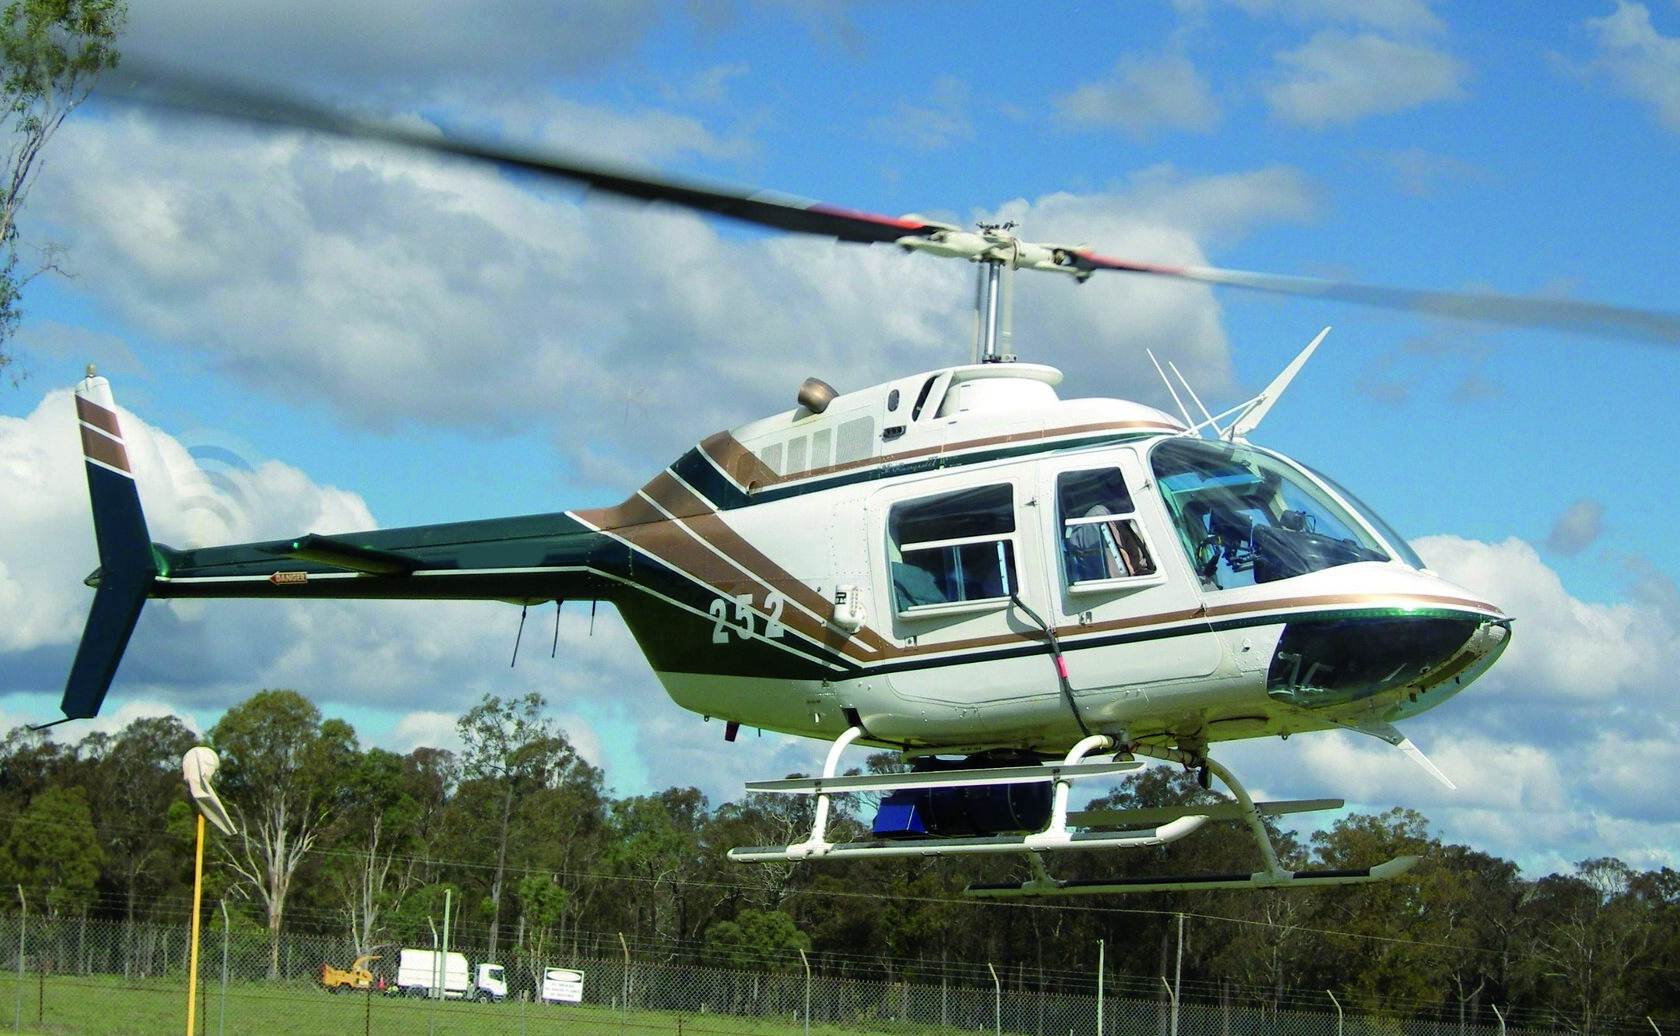
The system includes three channels, one of which is active and two are passive. In the active channel, a tunable laser illuminates the ground surface with 1 ms pulses emitted with the frequency of 750 Hz in order to provide a good spatial resolution under cruising speed of up to 100 km/hr and at the flight altitude of 80-100 m. Two passive channels operate in both the visible and IR band and are regarded as auxiliary because principle gas detection is achieved in the active channel. Video-monitoring a flight route allows better positioning laser profiles in respect to some ground-based check points, such as towers, oil derricks, buildings, roads, trees etc.
In its turn, the IR thermographic channel enables the monitoring of a buried pipeline by its surface temperature pattern. This enables tracking a pipeline route, evaluating pipe depth and, in some cases, detecting leaks by temperature anomalies. As it is known, IR thermographic images are vulnerable to a variety of noisy factors related to surface clutter, such as variations in emissivity and absorptivity of landscape elements. The potentials of IR thermography in the detection of gas leaks have been intensively explored for the last decade [2]. The influence of gas pressure, defect size, wind speed and some other parameters has been analyzed within the VOGUE international project.
However, our experience of exploiting the system described below in cooperation with Russian gas transportation companies has shown that the efficiency of detecting gas leaks by using only a passive IR channel is low and the corresponding technology requires further improvement. In the GLD system, IR thermographic monitoring allows for locating zones where buried pipes pop up close to the ground surface that makes them vulnerable for possible industrial activity impacts. Therefore, we believe that, at the current level of technical performance, IR thermography provides support data to that obtained in the active laser channel.
In the active channel, gas leak detection is based on the spectroscopic analysis of laser radiation which passes in the atmosphere through a gas plume and after being scattered by the ground surface is captured by an IR detector. The pulsed laser diode operates at the wavelength near 1650 nm (1.65 μm) that corresponds to one of the strong methane absorption lines with the pulse duration 1 ms and the mean power 15 mW. The radiation wavelength is spectrally scanned within the band of the 0.3 nm width in each pulse. The laser radiation is split into two beams. The first laser beam called ‘analytical’ irradiates the ground surface. A small part of the reflected radiation is captured by a parabolic mirror and focused onto an InGaAs photodetector. The second (‘reference’) laser beam first passes through a cuvette filled with methane and then is focused onto the second photodetector. Real time treatment of recorded signals results in calculating 2LC values, where L is the distance from the device to a scanned object which reflects laser radiation and C is the mean methane concentration along the optical path length (2L). The resulting values are expressed in ppm*m units, where ppm (parts per million) is the quantity of methane molecules per million molecules of air.
Unlike the systems which implement multiple laser beam passages through a cuvette, the described unit allows determining gas concentration independently on gas plume shape and size. Data recording and preliminary processing is performed in on-line regime thus ensuring high inspection efficiency. The implied operation principle is free from many false indications inherent to laser systems operating at the 3390 nm wavelength because of the short detection time (1 ms) and the chosen shorter wavelength (1650 nm) where water absorption is low.
Minimum detectable gas concentration
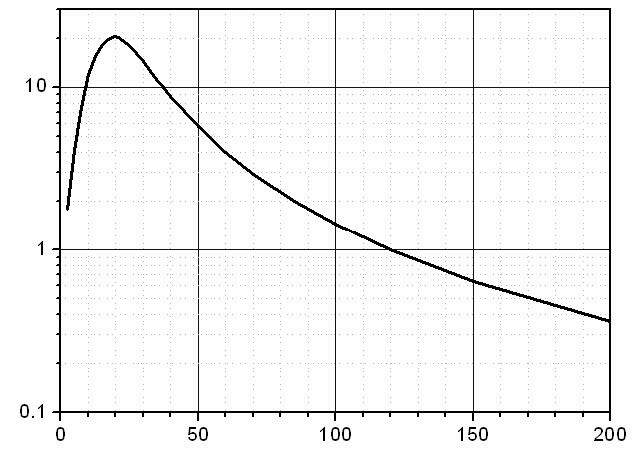
The efficiency of gas detection systems depends on gas concentration, plume size and system NEP (Noise Equivalent Power) sensitivity threshold. At low laser radiation power P, minimum detectable gas concentration is limited by performance of a receiving system (IR photodetector and electronics). In the case of high P values, it is limited by laser instability. InGaAs photodetectors with optimized electronics are characterized by noise standard deviation of about 2 picoW within the frequency range of 15 kHz. The photodetector transformation factor is about 1.2 mV/nW. The dependence of detectable gas concentrations (in ppm*m) on a system output signal (in mV) is presented in Figure 2.The power of the laser reflected radiation sensed by a photodetector and the corresponding output signal depend on the laser power, the objective aperture ratio, the reflectivity of tested objects at the 1650 nm wavelength and the distance L between the objects and the GLD system. If GLD parameters are optimized, the system performance strongly depends on L, and the detectable gas concentration is inversely proportional to L2. This factor limits the use of scanning laser systems, where the signal frequency range is to be wide because of two-dimensional scanning. The relationship between the system output signal (in mV) and the distance L (in m) is shown on Figure 3.
According to the handbook data and our experimental results, standard topographical objects, such as sand, soil, vegetation, bricks, asphalt, concrete, etc., are diffusive with the reflection coefficients ρ at 1650 nm being in the range from 0.3 to 0.4 (white snow has ρ ~0.05).
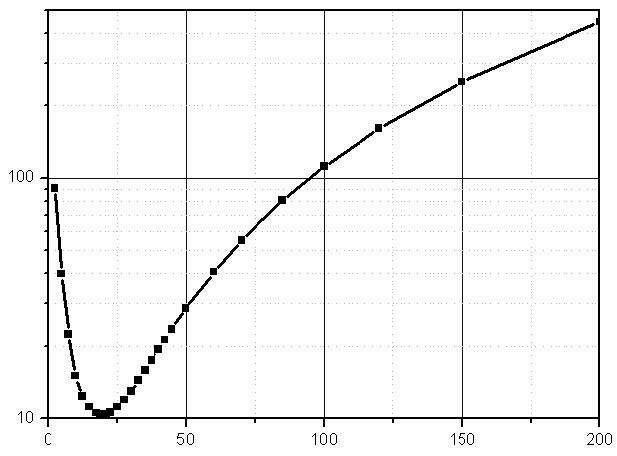
The combination of the data from Figures 2 and 3 allows obtaining the detection limit by methane concentration (Figure 4). Note that the well-visible minimum in the limit concentration vs. distance curve is explained by a particular ratio between a scanned spot size and a laser spot size.
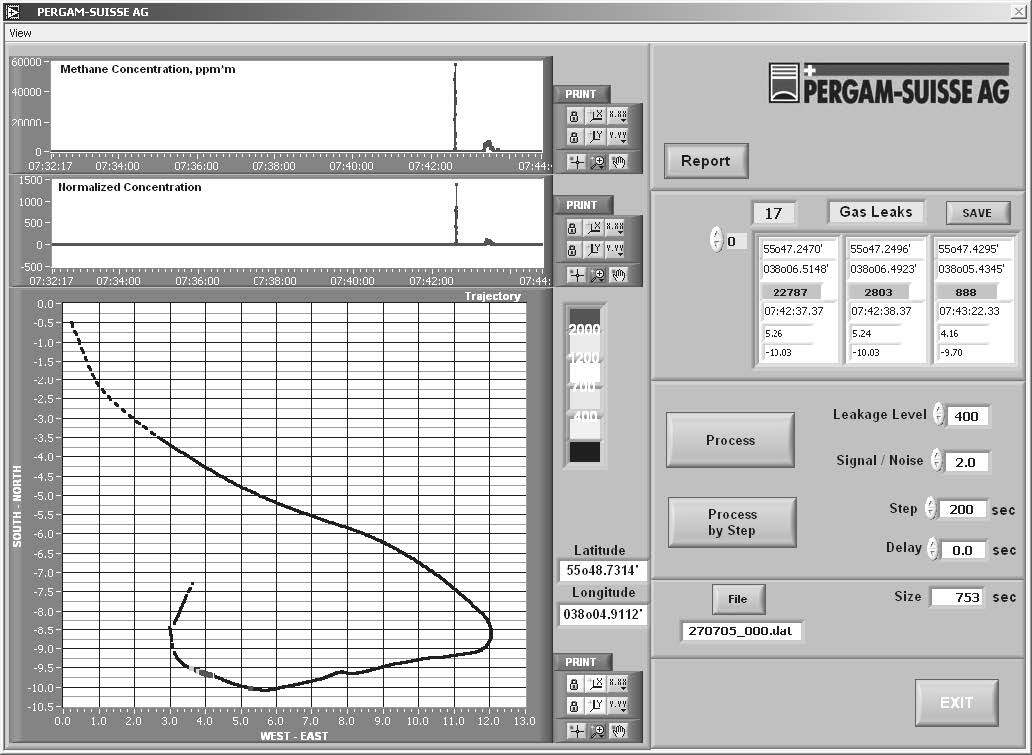
- Time dependence of measured methane concentrations;
- Time dependence of a signal/noise ratio;
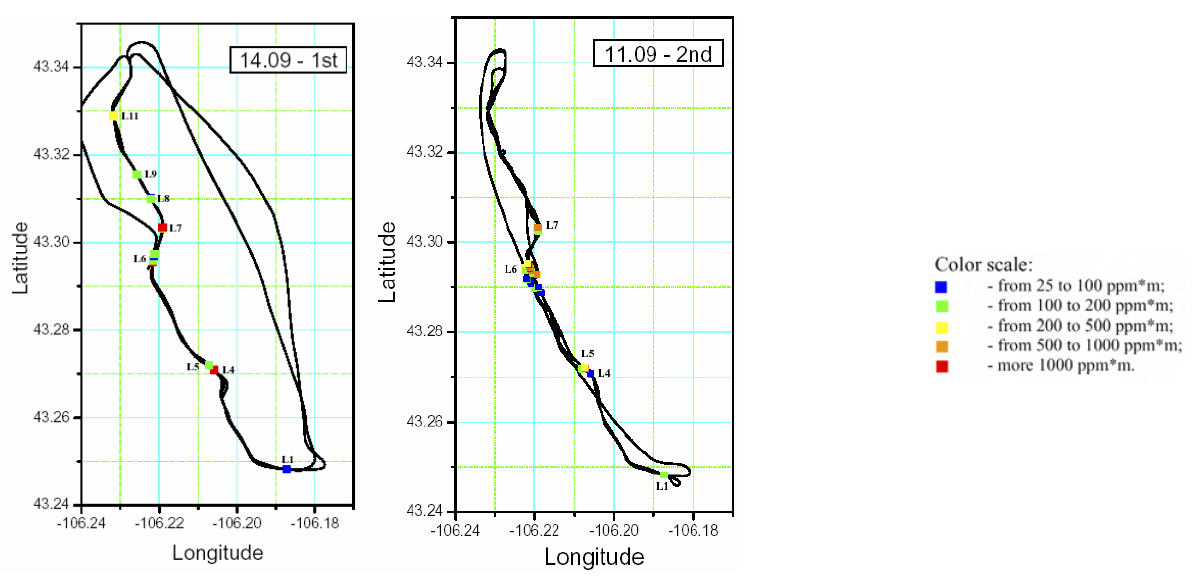
- Motion path with color indication of increased methane concentration; this path can be called up together with an electronic map to facilitate coordinate positioning (Figure 6);
- Current latitude and longitude values, accuracy up to 10-4 angle minute;
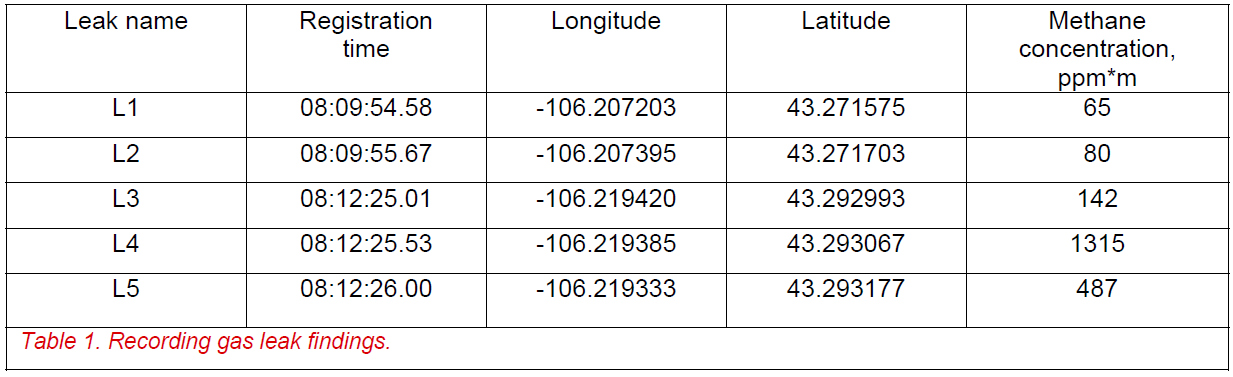
- Table of recorded leaks which contains the following parameters: latitude, longitude, average methane concentrations (ppm*m) at leak points, time when leaks have been detected and coordinates (X, Y) of each leak point.
Minimum detectable methane concentration, ppm*m
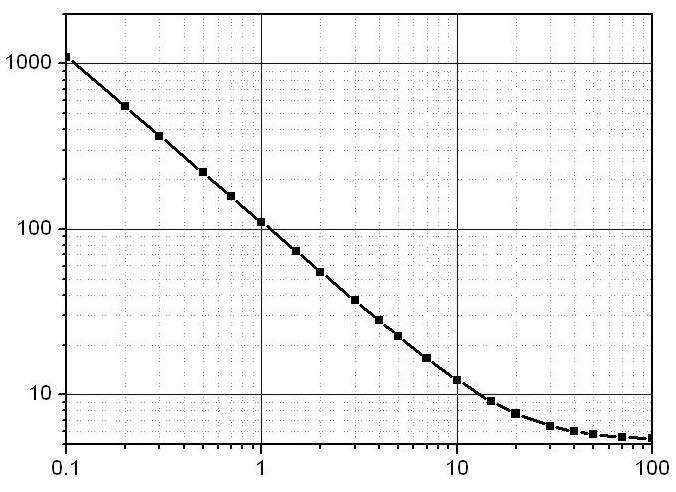
IR detector signal, mV
IR detector signal, mV
Distance, m
Minimum detectable methane concentration, ppm*m
Distance, m
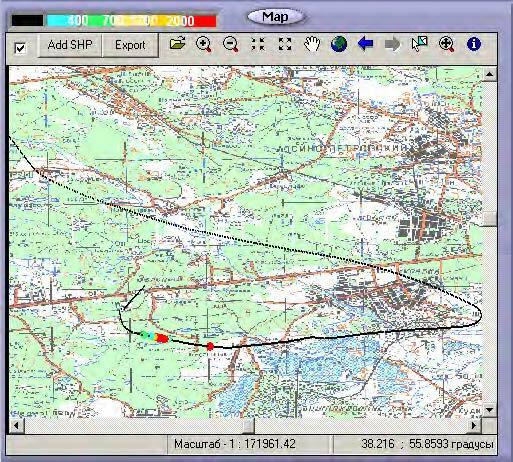
An example of flight route records is provided in Figure 7. Once a leak is detected and evaluated, the route color indication changes from green to red. For instance, in one of ALMA test flights up to 159 gas leak indications were recorded. The example of a gas leak list recorded in a particular test flight is given in Table 1.
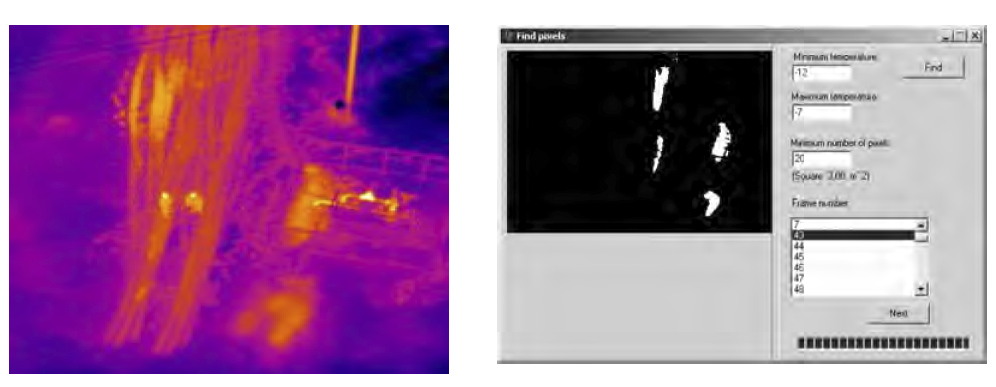
As mentioned above, IR thermographic findings play an auxiliary role in detecting gas leaks. Two examples are given in Figure 8, 9. Often, gas leaks occur near compressor stations. The IR image of a cranage point is shown in Figure 8a. The first step of advanced data treatment is segmentation and binarization of source images. Areas of a pre-defined size can be binarized within a particular temperature range (Figure 8b). A gas leak seen as the bottom right orange-color spot accompanied by some clutter indications was confirmed by the corresponding data in the laser channel.
The second step of IR thermographic data treatment relies on the result of solving a 3D heat conduction problem for a pipe buried in soil (Figure 9a). This solution allows connecting surface temperature signals and pipe depth as a function of meteorological conditions, soil thermal properties, pipe diameter, gas temperature and other parameters.
The inverse solution is implemented into the IRLeak software which enables the ability to approximately estimate pipe depth by analyzing IR thermogram. For example, a typical IR presentation of six buried gas pipes is shown in Figure 9b. The program window intended for evaluating pipe depth is shown in Figure 9c. A critical input parameter which drastically influences the efficiency of estimation is soil thermal conductivity, therefore, relative variations in pipeline depth rather than absolute depths are typically estimated. The abovementioned algorithm is currently under verification and further development.
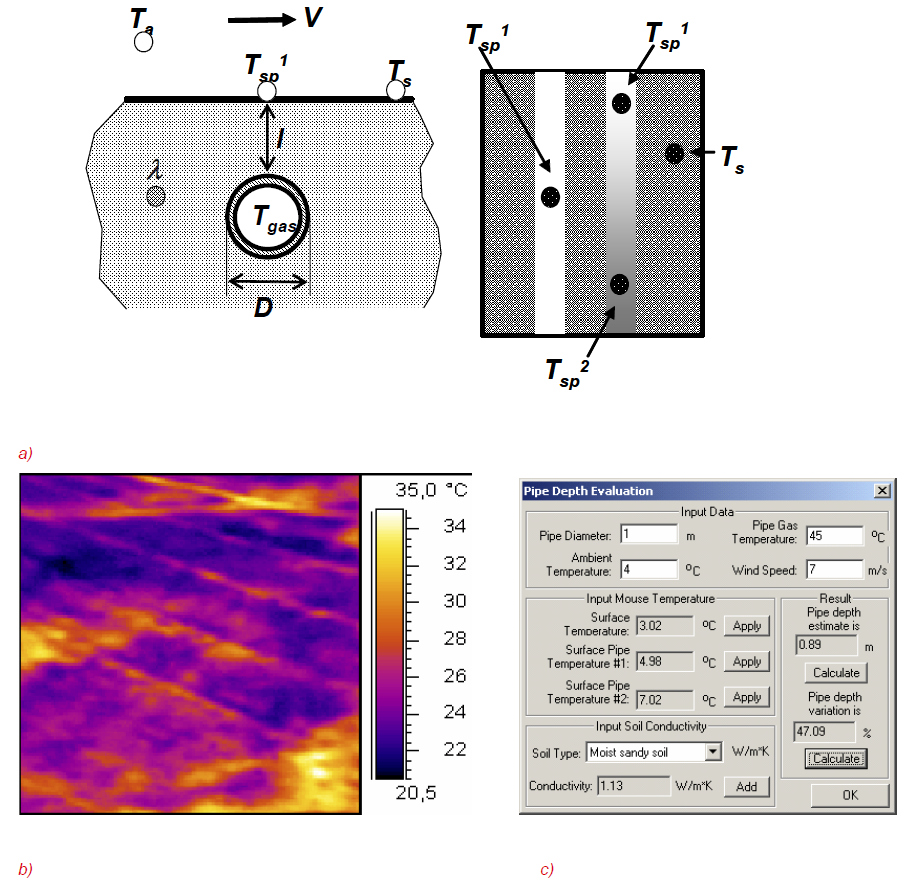
b – IR image of six underground pipes,
c – evaluating pipe depth.
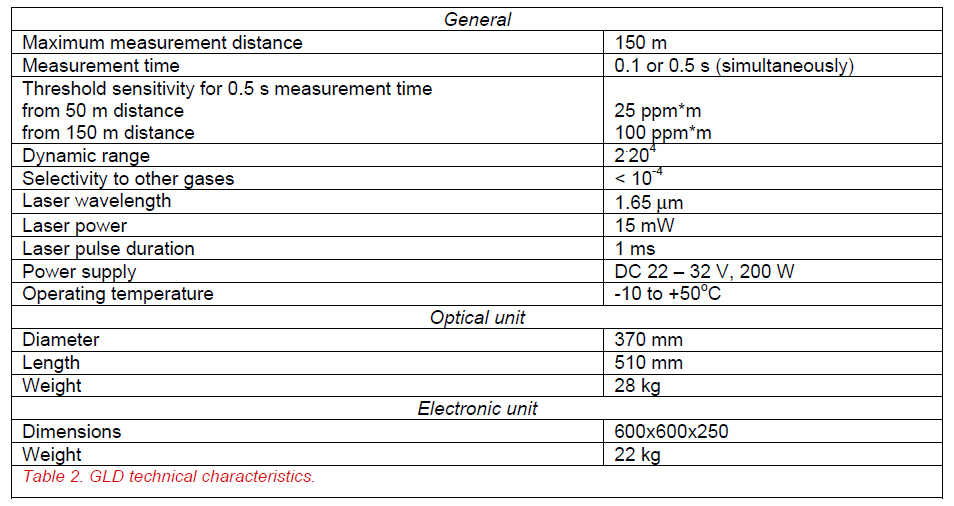
System Technical Performance
Technical characteristics of the system are given in Table 2.